
Disclaimer: The information contained in this article is provided for informational and educational purposes only and does not constitute financial advice, investment solicitation, or trading recommendation of any kind. Any investment decision remains solely the responsibility of the reader.
Transparency Note: This content was created with the support of artificial intelligence tools for research and content generation purposes. The information was subsequently reviewed, verified, and assessed by the author.
A week ago, the central question was whether the global oil system still had enough adaptive capacity to absorb the Middle East shock without requiring another repricing in OIL.
China had sharply reduced purchases. Inventories were still acting as a buffer. Alternative pipelines were partially offsetting the disruption in Hormuz. Ship-to-ship transfers, Russian crude, additional barrels from the Americas, and progressive demand destruction were all helping preserve a degree of balance.
For that reason, the area equivalent to $92–93 on WTI was interpreted not only as a technical resistance zone, but also as a useful threshold for measuring how much shock-absorption capacity remained in the system.
The following week provided an initial answer.
That area was broken. The move quickly extended toward $96–97, Brent moved above $100, and within a matter of days WTI was also trading firmly in triple-digit territory.
The more important development, however, was not price alone.
The nature of the problem gradually changed.
The market moved from assessing the risk of losing supply to assessing the vulnerability of the infrastructure used to replace that supply when primary routes become difficult to access.
The key concept is therefore deliverable supply: not simply how many barrels exist, but how many can actually reach the market.
1. What the week confirmed
The September 7 framework was built around a clear sequence:
shock → buffer → buffer erosion → repricing.
Subsequent developments remained broadly consistent with that structure.
| September 7 thesis | What happened next | Assessment |
|---|---|---|
| China as the main shock absorber | Imports remain depressed, but Chinese refiners are becoming more active in the spot market | Confirmed, with the buffer narrowing |
| WTI $92–93 as a key threshold | The area was broken and then left behind to the upside | Confirmed |
| Breakout toward $96–97 | Reached in roughly 48 hours | Confirmed |
| Above $97, entry into a second phase of the shock | Brent and WTI both moved above $100 | Confirmed |
| Repeated attacks on shipping as a potential regime shift | Pressure on tankers became more systematic | Confirmed |
| Refined products potentially tighter than crude | U.S. diesel moved above $6/gal while exports from the Gulf and Russia declined | Confirmed |
| Logistical bypasses helping offset Hormuz | They worked initially, but the Saudi East-West Pipeline was later hit | Initially confirmed, then weakened |
| AIS counts as an indicator of Hormuz stress | Dark crossings suggest actual volumes are higher than visible traffic implies | Methodology needs refinement |
| Diplomatic normalization as the main downside risk | Negotiation headlines triggered a sell-off without verified physical normalization | Still the main decompression risk |
The most useful takeaway was therefore not a specific numerical target.
It was the sequence through which the system responds when the mechanisms used to offset lost supply begin to weaken.
2. A week of acceleration
On September 7, Brent closed at $97.31, while WTI was trading around $92.65.
Traffic through Hormuz was already severely reduced, while tensions between the United States and Iran were increasing the risk associated with shipping.
On September 8, pressure extended further toward Saudi infrastructure. Brent closed at $97.92, while WTI settled at $93.03.
On September 9, Brent moved above $100 and closed near $101.21, as the shipping disruption in the Gulf entered a more intense phase.
A further acceleration followed on September 10:
Brent +6.34% to $107.63
WTI +6.69% to $102.48.
Both benchmarks were now above $100.
On Friday, September 11, the market then pulled back on expectations of diplomatic progress. Brent closed at $104.61, while WTI settled at $100.05, still ending the week with gains of more than 8%.
By September 14, Brent had returned to the $107–108 area, with U.S. crude trading around $103.
The price structure observed one week earlier had therefore already been surpassed.
At the same time, the variables supporting the new regime had also changed.
3. The central shift: logistical redundancy is shrinking
As long as the problem remained concentrated around Hormuz, the system still had alternatives.
Saudi Arabia could redirect part of its flows toward Yanbu through the East-West Pipeline.
The United Arab Emirates retained access to Fujairah.
Other barrels could be rerouted through longer shipping routes, ship-to-ship transfers, or replaced by supply from the United States, Canada, Africa, South America and Russia.
Hormuz could therefore operate under severe disruption without automatically producing an equivalent loss in global supply.
The system still had redundancy.
This week, part of that redundancy was also affected.
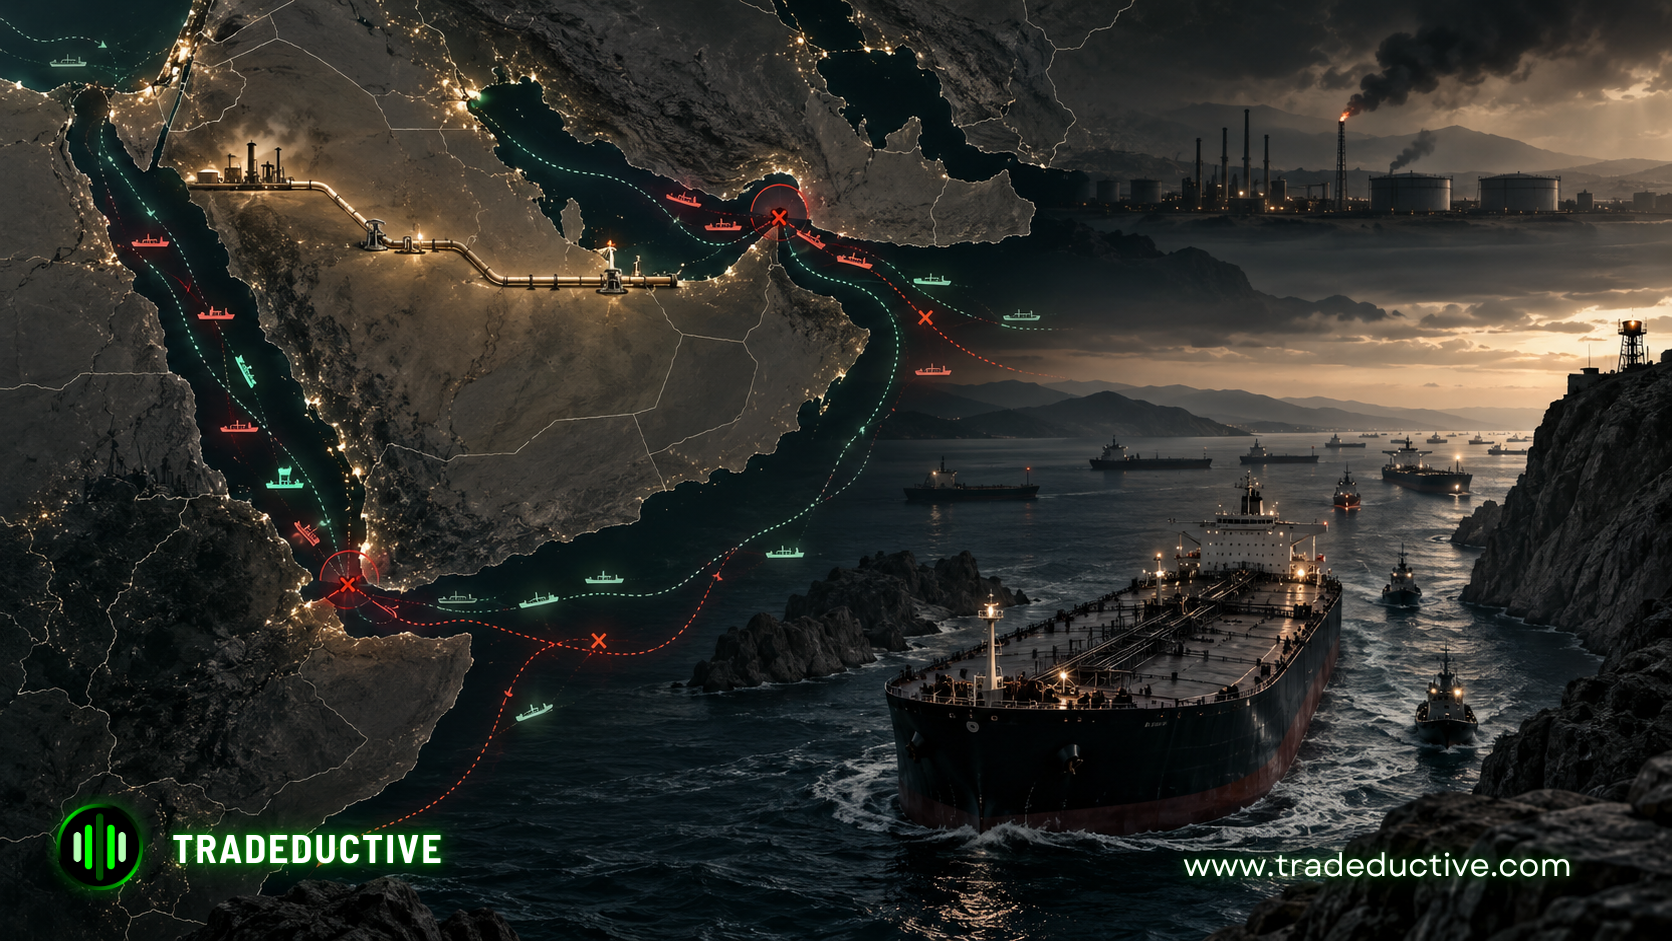
Saudi Arabia’s East-West Pipeline, running roughly 1,200 kilometers across the Arabian Peninsula, was temporarily shut after an attack.
In recent months, the pipeline had carried approximately 4–5 million barrels per day, equivalent to around 4–5% of global oil supply, toward the Red Sea terminal at Yanbu.
Its role was particularly relevant because it allowed Saudi crude to move westward without relying on passage through Hormuz.
The problem therefore has a different structure from the disruption of a single tanker.
A vessel represents part of the flow.
A pipeline represents part of the infrastructure used to redistribute that flow when the primary route is impaired.
The market must therefore assess not only the original disruption, but also the remaining ability to compensate for it.
4. East-West Pipeline: time becomes part of the fundamental picture
According to available estimates, roughly 4 mb/d had recently been rerouted through the East-West Pipeline.
With the infrastructure offline, Yanbu is believed to hold enough inventories to sustain exports for approximately 5–7 days.
Estimates for the repair timeline remain uncertain. Some sources point to several weeks, while others suggest that at least a partial restart could happen sooner.
The key issue is therefore not simply the extent of the damage.
The central variable becomes the relationship between:
the speed of pipeline restoration
and
the rate at which available Yanbu inventories are being consumed.
If the pipeline returns to service quickly, even at partial capacity, the system would recover some of its adaptive capacity.
If inventories begin to decline while the pipeline remains substantially unavailable, a larger volume of Saudi crude would become harder to move into international markets.
The oil would still exist from a production standpoint.
What would change is the amount that can effectively be delivered.
That is the distinction between supply and deliverable supply.
5. Bab el-Mandeb: rising risk, traffic still moving
A second variable that needs to be separated carefully is Bab el-Mandeb.
The Houthi advance toward Mocha and Perim increases the strategic risk surrounding the strait.
Bab el-Mandeb handles roughly 7% of global oil flows and a meaningful share of global trade.
For now, however, traffic has not contracted to the same extent seen in Hormuz.
During the weekend, 24 and 27 commodity vessels were recorded, levels broadly consistent with the recent average.
The current picture can therefore be divided into three components:
Hormuz: physical disruption already materialized.
East-West Pipeline: physical disruption already materialized, duration still uncertain.
Bab el-Mandeb: elevated potential risk, while traffic remains operational.
This distinction matters because it prevents potential events from being treated as if they had already occurred.
If Bab el-Mandeb were to show a persistent reduction in traffic, the system would move into a different configuration:
a dual-chokepoint regime.
In that case, both a primary route and part of the infrastructure used to bypass it would be impaired at the same time.
6. Hormuz remains impaired, but AIS counts alone are no longer sufficient
One methodological revision concerns how traffic through the strait should be measured.
The number of vessels visible through AIS remains useful, but it cannot be treated as equivalent to actual physical volume.
A growing share of tankers are crossing Hormuz with AIS systems switched off or with incomplete tracking.
Estimates that incorporate these so-called dark crossings have, at times, placed total Gulf exports near 15–16 mb/d, higher than visible vessel counts alone would suggest, while still remaining below pre-war levels.
More recent estimates place flows through Hormuz near 10 mb/d, roughly half their pre-conflict level.
Future monitoring should therefore combine:
- visible transits
- dark crossings
- tanker size
- direction of travel
- STS activity
- physical differentials
- freight
- insurance.
The existence of dark crossings does not imply a return to normal conditions.
It indicates that part of the flow continues to move through less transparent and generally more expensive channels.
Actual transported volumes are therefore higher than immediately visible data suggest, but still below the previous regime.
7. The physical market is revealing the value of deliverability
Individual crude grades are providing one of the clearest signals.
The global oil market is becoming more geographically fragmented.
Nominal availability does not necessarily translate into accessibility.
Iraq’s Basrah Medium for October has been offered at a discount of roughly $43/bbl to Murban, while Qatar’s Al-Shaheen has traded at a discount of around $25.
Both grades depend on passage through Hormuz.
Murban, by contrast, can reach Fujairah by pipeline without crossing the strait.
The behavior of Upper Zakum after clearing the chokepoint also shows meaningful premiums relative to Dubai.
Outside the Middle East, the opposite pattern is emerging.
Crude that can be accessed without relying on the main areas of disruption is receiving higher premiums.
Australian Pyrenees was assessed on September 11 at around:
$138.04/bbl
against Brent futures at $104.61.
Angolan Cabinda was assessed around:
$118.46.
These prices do not imply that the entire oil market is worth the same amount.
They show that the market is assigning an increasingly high premium to barrel mobility.
The relevant question becomes:
Which crude can be delivered, where, how quickly and at what logistical cost?
Scarcity is no longer evenly distributed.
It increasingly depends on geography and on the ability to move the product.
8. OIL as the core of the analysis, benchmarks as reading tools
This environment also highlights the limitations of using a single benchmark to represent the entire market.
WTI and Brent remain essential references, but neither can capture every source of stress in the system on its own.
Brent is particularly useful for tracking global repricing.
WTI remains central for technical structure, U.S. liquidity and the transmission of the move into the American market.
The higher-level object of analysis, however, remains OIL as a system.
A more appropriate hierarchy for the current regime is:
OIL SYSTEM
↓
physical grades
↓
Brent / WTI benchmark structure
↓
refined products
↓
shipping / freight / insurance
This approach makes it possible to separate benchmark performance from the condition of the underlying physical system.
9. China: from shock absorber to more active marginal buyer
China continues to play an important role in the broader picture.
On September 7, seaborne arrivals were estimated at around 7.14 mb/d, nearly 40% below the 11.41 mb/d average recorded during the three months preceding the war.
The decline was approximately 4.27 mb/d, nearly equal to the total contraction in Asian imports.
At that stage, lower Chinese purchases were acting as a stabilizing mechanism.
A meaningful share of the barrels no longer available to the market did not need to be replaced immediately.
Over the past week, however, signs of change have emerged.
Chinese independent refiners have begun searching more actively for alternative cargoes from:
West Africa, Canada and South America.
Purchases over recent weeks are estimated to have already exceeded 20 million barrels, while spot premiums for some China-bound supplies have risen by more than $10/bbl in two weeks.
The sequence therefore becomes:
Chinese imports ↓
→ part of the shock is absorbed.
Iranian/Russian cheap barrels ↓
→ the need for replacement barrels increases.
refining margins ↑
→ the economic incentive to process crude increases.
China spot buying ↑
→ part of the earlier shock-absorption capacity is reduced.
China therefore remains a buffer.
But that buffer appears smaller than it was during the initial phase.
10. Procurement demand and end-user demand are not the same thing
To interpret China correctly, it is necessary to distinguish between:
procurement demand
and
end-user demand.
Sinopec still expects Chinese oil demand to fall by roughly 600 kb/d in 2026, equivalent to -3.9%, with gasoline down 8.7% and diesel down 11.4%.
China can therefore simultaneously:
consume less on a structural basis
and
increase crude purchases on the international market.
Refiners may need to replace Iranian or Russian barrels, rebuild feedstock inventories, take advantage of stronger crack spreads, replenish storage or produce more refined products for export.
A recovery in spot purchases should therefore not automatically be interpreted as stronger final demand.
It instead signals increased competition for available barrels.
China’s role can therefore be summarized as follows:
logistics determines the scarcity available to the market; China helps determine how quickly that scarcity is absorbed.
11. The progressive depletion of buffers
One of the most relevant statistics of the week concerns inventories.
According to the IEA, observed inventories have fallen by approximately:
507 million barrels
since February, at an average draw rate of:
2.8 mb/d.
In August alone:
-95 million barrels
equivalent to around -3.1 mb/d.
This helps explain why the market is becoming more sensitive to subsequent disruptions.
During the early phase of the crisis, larger inventories allowed the system to offset lost flows temporarily.
As those inventories are progressively drawn down, the ability to keep replacing missing barrels through stocks declines.
The structure therefore shifts from:
shock + large buffer
to:
shock + progressively depleted buffer.
That makes each additional disruption more relevant.
12. Supply and demand are adjusting at different speeds
The IEA now expects global supply to decline by:
5.7 mb/d
in 2026, against an estimated demand decline of roughly:
2.5 mb/d.
Even with demand destruction underway, the expected loss of supply remains larger.
The difference has to be absorbed through:
inventories, geographical substitution, new production or further demand reduction.
Uncertainty on the demand side remains high.
OPEC still expects global oil demand to grow by around:
+380 kb/d
in 2026.
The IEA expects:
-2.5 mb/d.
The gap between those two assessments highlights the difficulty of estimating demand elasticity in a high-price environment.
Demand should therefore not be treated as a static variable.
It is increasingly dependent on the energy price itself and on its broader impact on economic activity.
13. Saudi Arabia: production capacity and deliverable capacity
The IEA estimates that Saudi supply fell by approximately 2.3 mb/d in August, reaching:
6.0 mb/d
the lowest level in more than three decades.
Saudi Arabia is also reported to have communicated production near 6.2 mb/d to OPEC, compared with 10.9 mb/d in February.
These figures show why OPEC+ spare capacity alone is not enough to describe the current situation.
A distinction is required between:
nominal production capacity
and
deliverable production capacity.
The theoretical ability to produce a barrel does not automatically mean that barrel can be loaded, insured, transported and delivered.
Higher production quotas may increase upstream availability.
They do not, by themselves, solve constraints involving pipelines, tanker availability, chokepoints or war-risk insurance.
In the current regime, all of these components contribute to effective supply.
14. Refined products continue to show downstream stress
The refined-products market suggests that crude is not necessarily the tightest segment of the chain.
According to the IEA, exports of refined products and LPG from the Gulf remain almost 60% below February levels.
Net diesel/gasoil exports from the Gulf in August were around 390 kb/d, little more than one quarter of pre-war levels.
Including reductions from Russia associated with refinery disruptions, the Gulf and Russia together are estimated to have lost approximately:
1.6 mb/d of diesel/gasoil exports
relative to February.
In the United States, retail diesel has also moved above:
$6 per gallon.
The transmission mechanism can therefore be observed across the full chain:
crude → refinery → diesel → shipping → inflation.
The stress is not confined to the price of the barrel.
It is progressively transmitted into the products required for transport and economic activity.
15. EIA data help isolate the dominant driver of the week
The EIA report for the week ending September 4 did not show a particularly bullish domestic configuration.
Commercial crude:
-0.4 million bbl → 424.1 million
Gasoline:
+1.3 million
Distillates:
+2.1 million
Refinery utilization:
97.8%.
Four-week implied total demand was also running around 3.7% below year-earlier levels.
Despite that backdrop, WTI gained nearly 7% on September 10.
That divergence helps isolate the dominant driver.
The rally was not primarily driven by U.S. inventories.
It was driven mainly by the condition of global supply and the ability to physically move that supply to market.
In short:
global deliverability driven.
16. The Brent curve separates immediate scarcity from future expectations
On September 11, the Brent futures structure was approximately:
| Brent contract | Price |
|---|---|
| Nov 2026 | $104.77 |
| Dec 2026 | $99.86 |
| Jan 2027 | $95.59 |
| Mar 2027 | $89.09 |
| Jun 2027 | $82.66 |
| Dec 2027 | $77.12 |
The spread between November 2026 and June 2027 was approximately:
$22 of backwardation.
The curve is therefore expressing two separate views.
Immediate market
Deliverable crude remains limited, and the market is assigning a premium to current availability.
Deferred market
Participants continue to price in progressive normalization over the following months.
The spot market and front end of the curve are therefore signaling present scarcity.
The longer-dated part of the curve continues to treat that scarcity as largely temporary.
For that reason, the evolution of 2027 contracts may become particularly informative.
A further rise in the front month would indicate additional near-term stress.
A meaningful rise in the back end of the curve would instead suggest that expectations of future normalization are beginning to weaken.
17. Above $100, the macro feedback becomes stronger
The main rebalancing force does not necessarily have to come from higher production.
It can be generated by the price itself.
The sequence is:
OIL ↑ – inflation ↑ – yields ↑ – tighter monetary conditions → growth ↓ – OIL demand ↓
The U.S. 10-year Treasury yield has approached 5%, while the market has increased expectations for further Federal Reserve tightening.
The ECB has also already raised rates.
At lower price levels, oil mainly acts as a mechanism for allocating scarcity.
With OIL holding above $100, the effect increasingly extends to:
consumption, industrial margins, inflation, monetary policy and growth.
The rally therefore begins to create the conditions that can eventually constrain it.
For that reason, areas such as $115–120 should not automatically be treated as targets.
They are levels consistent with more severe physical disruption.
Tail risk and base case should remain separate.
18. Diplomacy remains the main channel for decompression
Friday showed how quickly geopolitical premium can compress when expectations of normalization emerge.
Brent had reached $109.97.
Reports of possible regional talks concerning Hormuz contributed to a rapid move back toward $104.61, with WTI at $100.05.
The planned meeting between Iran and Gulf states was later postponed.
Iranian sources had already played down expectations that an immediate agreement would be reached.
It is therefore useful to distinguish between:
an agreement with observable effects on physical flows
and
a diplomatic development without verified physical consequences.
In the first case, the market could remove a meaningful portion of the premium already embedded in prices.
In the second, the effect may remain largely tactical.
Operationally:
narrative normalization is not the same as physical normalization.
19. The current OIL picture
| Component | Current state | Prevailing impact |
|---|---|---|
| Gulf crude availability | impaired | Bullish |
| Hormuz | operating, but impaired and expensive | Bullish |
| Dark crossings | offset part of the visible loss | Relatively bearish |
| East-West Saudi Pipeline | temporarily offline | Bullish |
| Bab el-Mandeb | traffic still moving, risk increasing | Potentially bullish |
| Saudi output | multi-decade lows | Bullish |
| Global inventories | around -507 million bbl since February | Bullish |
| Diesel/products | reduced availability | Bullish |
| China crude procurement | recovering | Bullish |
| China end-demand | structurally weak | Bearish |
| Global demand | contracting | Bearish |
| Non-OPEC Americas | supply growth | Bearish |
| Rates/inflation | more restrictive conditions | Bearish |
| Diplomacy | fragile, but capable of compressing the premium | Potentially bearish |
20. The decision framework has changed
A week ago, the central question was:
Will $92–93 hold?
That area now belongs to the previous price regime.
The current question is different:
What is a truly deliverable barrel worth when even the main alternatives to Hormuz become vulnerable?
The analysis can no longer be centered on a single WTI level.
It has to begin with the OIL system and then be translated into the individual benchmarks.
21. Price map
Brent — $100
The $100 level has become the first major threshold.
A sustained move below it would begin to suggest a reduction in the damage premium.
Holding above $100 indicates that the market continues to assign value to immediate scarcity.
Brent — $104/105
This is the settlement area reached after the first meaningful decompression move associated with diplomatic headlines.
It can therefore act as a useful pivot for assessing whether the market can absorb less supportive developments without losing the current structure.
Brent — $107/110
This is the area where the current tension between physical scarcity and macroeconomic feedback is concentrated.
The recent $109.97 high remains the immediate reference point.
Sustained trade above $110 would likely require continued physical disruption or new developments capable of further reducing deliverability.
Brent — $115/120
This is not the base case.
It becomes compatible with a more severe combination of factors:
- East-West Pipeline offline for an extended period
- material deterioration at Bab el-Mandeb
- Hormuz remaining impaired
- sustained Chinese procurement.
Under that scenario, the market would likely require additional demand destruction to restore balance.
WTI — $100
WTI has turned the $100 level from a psychological target into a pivot.
Above it, the structure remains consistent with the broader repricing of global deliverability.
A sustained move back below $97–100, while Brent remains materially higher, could instead indicate greater regional divergence and relatively stronger U.S. supply conditions.
WTI therefore remains an important analytical tool.
It does not, however, represent the entire global thesis on its own.
22. Three scenarios for the coming week
Base case — Managed scarcity, thinner buffers
The East-West Pipeline returns at least partially.
Bab el-Mandeb remains operational.
Hormuz stays impaired but passable.
China continues to buy without a further sharp acceleration.
Demand destruction limits the extension of the rally.
Under this configuration, OIL could consolidate within a higher price regime, with Brent largely trading in the:
$100–110 range.
This would not represent normalization.
It would be closer to a:
crisis equilibrium.
An equilibrium based on lower flows, higher logistical costs and greater dependence on remaining buffers.
Bullish scenario — Dual-route impairment
The East-West Pipeline remains materially disrupted.
Bab el-Mandeb begins to show a persistent physical decline in traffic.
Hormuz fails to recover.
Under this configuration, both a primary route and part of the infrastructure used to bypass it would be constrained at the same time.
The $110 area would therefore lose part of its natural resistance function.
The $115–120 range would become consistent with the market needing to generate additional demand destruction.
Bearish scenario — Restoration of redundancy
The Saudi pipeline returns quickly.
Bab el-Mandeb continues to operate normally.
Traffic through Hormuz improves.
No new major shipping disruptions emerge.
Diplomatic efforts begin to produce concrete effects.
Under this scenario, the market could quickly remove part of the damage premium.
The first signal would be:
Brent below $100.
The next relevant area would become:
$95–97.
A move back toward materially lower price regimes would still require observable physical normalization.
23. Variables to monitor
For the coming week, the framework can be reduced to ten main variables.
1. East-West Pipeline
Restart timing, effective capacity restored, damage estimates and the rate at which Yanbu inventories are being drawn down.
2. Bab el-Mandeb
Persistent changes in actual vessel traffic rather than statements or threats alone.
3. Hormuz
Estimated total physical volumes, not AIS counts in isolation.
4. China
Spot cargo purchases, refinery runs and product exports.
5. Physical differentials
The relative pricing of easily accessible crude versus grades constrained by chokepoints.
6. Freight and insurance
Further increases would indicate a deterioration in deliverability even without additional physical disruption.
7. Diesel cracks
They remain one of the most direct indicators of downstream stress.
8. Brent curve
A rise in 2027 contracts would be particularly relevant for assessing expectations around the duration of the crisis.
9. Diplomacy
What matters is the observable impact on physical flows.
10. Fed and Treasury yields
The macroeconomic feedback is increasingly capable of offsetting part of the bullish pressure in oil.
24. Updated market reading
The previous phase could be summarized as:
STRUCTURALLY BULLISH — BREAKOUT NOT YET CONFIRMED
That phase is now over.
The current configuration is more consistent with:
STRUCTURALLY BULLISH — DAMAGE PRICING CONFIRMED — LOGISTICAL PROPAGATION PHASE
With one important qualification.
The market is no longer pricing Hormuz alone.
Hormuz was the initial point of disruption.
Price formation now reflects a broader combination of factors:
- Hormuz
- tanker availability
- Saudi export infrastructure
- Red Sea risk
- refining scarcity
- inventories
- Chinese procurement
- freight
- insurance
- monetary tightening.
Price formation therefore depends on multiple layers of the same system.
Conclusion
A buffer does not eliminate a shock.
It spreads it over time.
For months, the system has offset part of the loss of functionality at Hormuz through alternative routes, inventories, new suppliers, lower Chinese purchases and progressive demand destruction.
Each compensating mechanism, however, relies on a finite resource:
stocks
logistical capacity
tankers
capital
spare refining capacity
final demand.
Global inventories have already fallen by more than 500 million barrels.
Saudi production is near multi-decade lows.
One of the main pipelines used to bypass Hormuz has been hit.
Bab el-Mandeb has become a more relevant strategic variable.
Chinese refiners are returning to compete for spot cargoes.
Refined products continue to show tighter availability.
At the same time, prices above $100 are reinforcing the opposite mechanism through demand destruction, inflation and tighter monetary conditions.
Two forces are therefore increasingly confronting each other:
declining deliverable supply
versus
price-induced demand destruction.
This does not imply a linear path for OIL.
It indicates that the system has less residual capacity to absorb additional disruption than it did during the early phase of the crisis.
The market no longer needs to determine whether a shock exists.
It now needs to determine:
how much redundancy remains before another disruption requires a further repricing.
That is the variable that, under the current regime, increasingly determines the marginal value of OIL.
Useful Frameworks for Reading the Market
The current OIL environment introduces several concepts that are useful not only for interpreting this particular crisis, but more broadly for understanding how an energy market behaves under logistical stress.
These are not isolated indicators. They are complementary tools for distinguishing between nominal supply, effectively available supply, shock-absorption capacity, and the mechanisms through which price restores balance.
Deliverable Supply
The amount of oil being produced is not necessarily the same as the amount that can actually reach the market.
A barrel must be:
produced → loaded → insured → transported → delivered.
A disruption at any point in that chain can reduce effective supply even when upstream production capacity remains unchanged.
During a logistics-driven crisis, the more useful question is therefore not simply:
How much oil is being produced?
but:
How much oil can actually reach the buyer?
Nominal Capacity vs Deliverable Capacity
Nominal production capacity measures how much a producer could theoretically extract.
Deliverable capacity measures how much of that production can actually be placed into the international market.
This distinction becomes particularly relevant when assessing OPEC+ spare capacity.
Available production capacity does not automatically offset:
- an offline pipeline;
- unavailable tanker capacity;
- a disrupted chokepoint;
- an inoperable terminal;
- higher insurance costs;
- a route that is no longer commercially viable.
Production capacity and delivery capacity should therefore be treated as separate variables.
Logistical Redundancy
Logistical redundancy is the set of alternatives available when one part of the energy network can no longer operate normally.
It can include:
alternative pipelines, secondary terminals, different shipping routes, ship-to-ship transfers, regional inventories, and substitute suppliers.
The resilience of the system therefore depends not only on the primary infrastructure, but also on the number and capacity of the alternatives available.
The more redundancy remains, the greater the system’s ability to absorb a disruption without requiring a major repricing.
Buffer Erosion
A market can temporarily absorb a shock through several buffers:
inventories
spare capacity
alternative pipelines
tanker availability
spare refining capacity
substitute suppliers
demand destruction.
These buffers are not unlimited.
As they are progressively used, the system loses part of its ability to compensate.
The same disruption can therefore produce very different price effects depending on how much shock-absorption capacity remains when it occurs.
Shock Absorber
A shock absorber is a variable that temporarily reduces the amount of repricing required to rebalance the market.
In China’s case, the initial sharp reduction in crude imports played this role.
Lower Chinese demand for crude meant less competition for the barrels that remained available.
A shock absorber does not remove the underlying problem.
It temporarily reduces its transmission into price.
Crisis Equilibrium
A sideways or relatively stable market does not necessarily imply normalization.
The market can reach a new equilibrium through:
lower flows
higher prices
higher logistical costs
weaker demand
greater inventory drawdowns.
This creates a crisis equilibrium.
The system continues to function, but under less efficient conditions than in the previous regime.
Price stability can therefore represent adaptation to a crisis rather than the end of it.
Damage Premium
The damage premium is the component of price associated with deterioration that is already observable in the physical system.
It differs from a conventional geopolitical risk premium.
Geopolitical risk reflects what might happen.
The damage premium reflects what has already started to affect:
flows, infrastructure, logistical costs, physical availability, or shipping insurance.
This distinction helps assess how much of the price could realistically disappear after a diplomatic improvement.
Risk Premium vs Damage Pricing
A geopolitical headline can create a risk premium before any physical loss has occurred.
Once tankers, pipelines, terminals, or flows are actually impaired, part of the market moves from:
risk pricing
to:
damage pricing.
The distinction matters operationally.
Diplomatic progress can compress a risk premium quickly.
Damage pricing generally requires actual restoration of the physical conditions that caused the disruption.
Narrative Normalization vs Physical Normalization
Narrative normalization occurs when:
negotiations, diplomatic statements, or political expectations reduce perceived risk.
Physical normalization requires observable evidence:
pipelines reopening
shipping recovering
freight rates falling
insurance premiums declining
physical differentials normalizing.
The two do not necessarily occur at the same time.
Financial markets typically attempt to anticipate physical normalization through the narrative.
For that reason:
The market can anticipate normalization. The physical system has to confirm it.
Barrel Mobility Premium
Two barrels with similar physical characteristics can trade at very different values if one can reach the buyer easily and the other cannot.
The barrel mobility premium is the value assigned to crude that can move without relying on impaired infrastructure.
When routes become the main constraint, the market begins to price not only:
the quality of the barrel
but also:
its location and its mobility.
Physical Differentials
Physical differentials compare the prices of different crude grades.
During a logistics-driven crisis, they can reveal information that Brent and WTI may not fully capture.
If an easily accessible crude trades at a strong premium while a grade trapped behind a chokepoint trades at a deep discount, the market is signaling a shortage of accessibility, not necessarily a shortage of oil in absolute terms.
Dual-Chokepoint Regime
A dual-chokepoint regime develops when more than one strategic logistical corridor is impaired at the same time.
The risk is not simply additive.
If a second disruption affects the very route being used to offset the first, the system loses redundancy.
In the current environment, relevant combinations include:
Hormuz + Bab el-Mandeb
or:
Hormuz + Saudi bypass infrastructure.
Second-Order Disruption
A first-order disruption directly affects the flow.
A second-order disruption affects the mechanism being used to compensate for the original shock.
For example:
Hormuz impaired
→ crude is rerouted through the East-West Pipeline.
East-West Pipeline impaired
→ the bypass itself is disrupted.
The second event therefore reduces the adaptive capacity of the system, not just the amount of supply.
Logistical Propagation Phase
An energy crisis can begin at a single point and then propagate through the network.
The sequence may look like:
chokepoint
→ tanker availability
→ pipeline
→ freight
→ insurance
→ refinery feedstock
→ refined products
→ inflation.
Once the crisis reaches this stage, analyzing only the original geopolitical event becomes insufficient.
Price is now reflecting interaction across multiple layers of the same system.
Procurement Demand vs End-User Demand
Higher crude purchases do not necessarily imply an equivalent increase in final demand.
A refiner may buy more crude in order to:
replace a supplier
rebuild inventories
take advantage of high crack spreads
increase product exports
hedge against future disruptions.
Procurement demand refers to the need to secure feedstock.
End-user demand refers to final consumption of gasoline, diesel, jet fuel, and other products.
Separating the two prevents higher crude purchases from being misread as structurally stronger demand.
Price-Induced Demand Destruction
Price itself progressively becomes a rebalancing mechanism.
The transmission chain can be represented as:
OIL ↑
→ fuel prices ↑
→ industrial costs ↑
→ inflation ↑
→ tighter monetary conditions
→ growth ↓
→ energy demand ↓.
When the system cannot quickly increase available supply, price must reduce the quantity demanded.
Demand destruction therefore behaves like a form of relative supply: it does not increase the number of barrels available, but reduces the number required.
Front-End Scarcity vs Deferred Normalization
Strong backwardation can help distinguish between:
immediate scarcity
and
expectations about how long that scarcity will last.
If mainly the nearby contracts rise, the market is saying:
barrels are needed now.
If longer-dated contracts remain much lower, the market is still pricing eventual normalization.
If the back end also begins to rise, the market’s assessment of the duration of the disruption is changing.
The curve therefore does not only measure price.
It also measures the time horizon the market assigns to the crisis.
Global Deliverability Driven
A move can be described as global deliverability driven when price is reacting primarily to the global ability to transport and deliver crude, while standard domestic indicators point in a different direction.
A strong WTI rally during relatively neutral EIA data is one example.
In that case, the U.S. market is not necessarily reacting to domestic inventories.
It is incorporating a repricing of the broader global oil system.
Dark Crossings
Dark crossings are transits that are not fully captured by standard AIS tracking.
During a maritime disruption, they matter because they can create a gap between:
the number of vessels observed
and
the actual physical volume being transported.
For that reason:
AIS count ≠ physical volume.
A more complete assessment should combine:
AIS
tanker size
direction
dark crossings
STS activity
physical pricing
freight
insurance.
Tail Risk ≠ Base Case
A scenario can be economically plausible without being the most likely outcome.
Simultaneous deterioration in Hormuz, the East-West Pipeline, and Bab el-Mandeb could justify materially higher prices.
That does not mean those prices should automatically be treated as targets.
The analysis should always distinguish between:
base case
alternative scenario
tail risk.
The purpose of a tail-risk scenario is to measure the system’s vulnerability to a less likely but potentially more disruptive combination of events.
ANALYTICAL STRATEGIES
1. Race of Clocks
Some situations are best understood as a competition between different timelines.
In the case of the East-West Pipeline:
time required to restore the pipeline
versus
time required to draw down the available inventories at Yanbu.
Neither variable fully describes the risk on its own.
If the pipeline is restored before inventories become insufficient, the system absorbs the disruption.
If inventories become critical before the pipeline returns, the problem begins to move from logistical risk toward observable physical scarcity.
The key variable is often which clock reaches zero first.
2. Follow the Redundancy
In an energy crisis, it is not enough to observe what has been lost.
The next step is to identify what the system is using to replace it.
The analytical sequence becomes:
primary infrastructure impaired
→ what alternative is being used?
→ how much capacity does it have?
→ how long can it operate?
→ what replaces the alternative if that is also disrupted?
This framework helps measure the system’s actual resilience.
3. Search for Second-Order Shocks
The most important events are not necessarily those generating the most headlines.
Another attack on a tanker may add tension.
An attack on the pipeline replacing Hormuz can instead alter the structure of the entire compensation mechanism.
The relevant question becomes:
Did the event hit the flow, or did it hit the system’s ability to replace the flow?
The second case generally has more persistent implications.
4. Read the Market as a Hierarchy
The analysis can begin with the physical system and work upward toward the benchmark:
OIL SYSTEM
↓
physical grades
↓
Brent / WTI
↓
refined products
↓
freight / insurance
This turns Brent and WTI into financial expressions of deeper market dynamics rather than the only sources from which the state of the market is inferred.
5. Read the Curve as a Clock
The futures curve can be interpreted as a distribution of stress through time.
Front-end rising sharply
Immediate scarcity.
Front-end elevated, back-end stable
The market still views the disruption as temporary.
Front-end and back-end both rising
Expectations of normalization are deteriorating.
Backwardation narrowing through a rising back end
The market is progressively extending the expected duration of the disruption.
The curve therefore becomes a measure of time expectations, not merely price.
6. Separate Headline from Confirmation
A headline can move price quickly.
Confirmation requires physical evidence.
After a diplomatic development, for example, the next questions should be:
Hormuz traffic ↑?
freight ↓?
insurance ↓?
physical differentials normalizing?
pipelines reopening?
If these variables do not change, the narrative has improved while the physical system remains largely unchanged.
7. Watch What the Benchmark Cannot See
A benchmark aggregates a large amount of information, but it can hide local dislocations.
That is why it is also necessary to monitor:
physical grades
regional premiums
discounts
refined products
freight
insurance.
When these markets diverge from the benchmark, they often reveal where the actual physical constraint sits.
8. Follow the Marginal Barrel
Price is not necessarily determined by the average barrel.
Under scarcity, it is increasingly influenced by the marginal barrel required to satisfy demand.
If that barrel has to come from:
a more distant region,
a different crude grade,
a more expensive route,
a tanker carrying a higher insurance premium,
the marginal cost rises.
The entire system can therefore reprice higher even when significant quantities of crude remain available elsewhere.
9. Separate Barrel Scarcity from Mobility Scarcity
There are at least two different forms of scarcity:
Barrel scarcity
There are not enough barrels.
Mobility scarcity
The barrels exist, but they cannot easily be moved to where they are needed.
The two conditions can produce different behavior in physical differentials and financial benchmarks.
The current crisis contains elements of both, but the mobility component has become increasingly important.
10. Monitor the Buffers Before the Price
Price often reacts after the system’s ability to compensate has already started to change.
Monitoring the buffers can therefore provide an earlier view of the market:
inventories
pipeline spare capacity
tanker availability
refinery spare capacity
China import flexibility
demand elasticity.
The objective is not to predict price mechanically.
It is to understand how much room remains before price itself must become the primary balancing mechanism.
KEY PRINCIPLES
Scarcity depends not only on how many barrels are available, but on how much redundancy remains in the system to move them where they are needed.
When the market loses the flow, it turns to inventories. When it loses the bypass as well, it turns to price.
A shock becomes progressively more price-sensitive when it consumes not only supply, but also the mechanisms used to replace that supply.
The market can anticipate normalization. The physical system has to confirm it.
It is not enough to know how many barrels exist. What matters is which barrels can actually be delivered.
In a logistics-driven crisis, the location of a barrel can become as important as the barrel itself.
The first shock reduces the flow. The second shock reduces the system’s ability to adapt.
Price stability does not necessarily imply normalization. It may represent a crisis equilibrium.
The futures curve tells us not only how much the market is paying for scarcity, but also how long it expects that scarcity to last.
As buffers shrink, the same shock requires a larger repricing.
Simplified Framework
The full process can be reduced to the following sequence:
SHOCK → SUPPLY LOSS → BUFFER ACTIVATION → LOGISTICAL ADAPTATION → BUFFER EROSION → DELIVERABLE SUPPLY DECLINES → PHYSICAL DIFFERENTIALS WIDEN → BENCHMARK REPRICING → DEMAND DESTRUCTION → NEW EQUILIBRIUM
The core idea is that price does not react only to the amount of oil that has been lost.
It also reacts to how much adaptive capacity remains in the system.
SOURCES
- Reuters — September 7, 2026
Oil prices rise to six-week highs on worsening Middle East conflict. - Reuters — September 7, 2026
China’s crude oil imports stayed weak in August. Can this continue? - Reuters — September 8, 2026
Oil prices hit six-week high after Houthis attack Saudi sites. - Reuters — September 9, 2026
Brent settles at over $100 a barrel as Middle East conflict intensifies. - Reuters — September 9, 2026
One third of Gulf oil is still missing despite “dark crossings”, data shows. - Reuters — September 9, 2026
China oil demand to fall 3.9% in 2026, Sinopec research says. - Reuters — September 10, 2026
Oil surges 6%, Brent and US crude both surpass $100 on more tanker attacks. - Reuters — September 10, 2026
China independent refiners scramble for oil, underpinning spot premiums. - Reuters — September 11, 2026
Oil falls but heads for 8% weekly gain on tight supply; US diesel hits record. - Reuters — September 11, 2026
IEA warns 2026 oil supply gap will widen on delayed return of normal Gulf flows. - Reuters — September 12, 2026
Saudis shut down oil pipeline as Houthis tighten grip on Red Sea shipping. - Reuters — September 13, 2026
Saudi pipeline outage threatens loss of 4% of global oil supply. - Reuters — September 13, 2026
Diplomacy stumbles with postponement of meeting on Strait of Hormuz proposal. - Reuters — September 14, 2026
Hormuz shipping traffic remains below 10-day average at weekend, data shows. - Reuters — September 14, 2026
When it comes to crude oil prices, it’s location, location, location. - Reuters — September 14, 2026
Oil markets survived Iran war sprint. Now comes the marathon. - Reuters — September 14, 2026
Morning Bid: Shipping oil gets ever harder, costlier. - International Energy Agency — Oil Market Report, September 2026
- U.S. Energy Information Administration — Weekly Petroleum Status Report, week ending September 4, 2026
- ICE — Brent Crude Futures pricing, September 11, 2026