
Disclaimer: The information contained in this article is provided for informational and educational purposes only and does not constitute financial advice, investment solicitation, or trading recommendation of any kind. Any investment decision remains solely the responsibility of the reader.
Transparency Note: This content was created with the support of artificial intelligence tools for research and content generation purposes. The information was subsequently reviewed, verified, and assessed by the author.
Summary
The oil market has entered a different phase. For weeks, the risk surrounding the Strait of Hormuz had been dominated by statements, threats, negotiations, partial restrictions and repeated swings between expectations of reopening and renewed escalation. Over the weekend of September 5–6, however, the situation moved one step further: the United States and Iran directly targeted vessels linked to oil transportation, bringing commercial shipping more explicitly into the military dynamics of the conflict.
At the same time, Iran announced plans to introduce a new restricted zone in the Gulf and new navigation maps through Hormuz, while the average number of commodity vessels transiting the Strait over the past ten days fell to around 10 per day, the lowest level since May. OPEC+, rather than immediately offsetting the higher level of risk, kept its production policy unchanged for October.
And yet WTI has not immediately moved to $100, $110 or $120. Instead, it continues to confront the $92–93 area.
That apparent contradiction may now be the most important feature of the entire market.
The physical deterioration is real, but the system has developed a series of shock absorbers: lower Asian imports, especially from China; inventory drawdowns; greater use of Russian crude; longer and alternative routes; ship-to-ship transfers; operational adaptation; and marginal demand destruction. China in particular has reduced seaborne crude imports from a pre-conflict average of 11.41 million barrels per day to 7.14 million bpd in August, accounting for almost the entire decline recorded across Asia.
The market is therefore caught between two opposing forces.
On one side, the physical and logistical availability of oil continues to deteriorate.
On the other, the system continues to reduce, substitute and redistribute demand sufficiently to prevent an immediate explosion in crude prices.
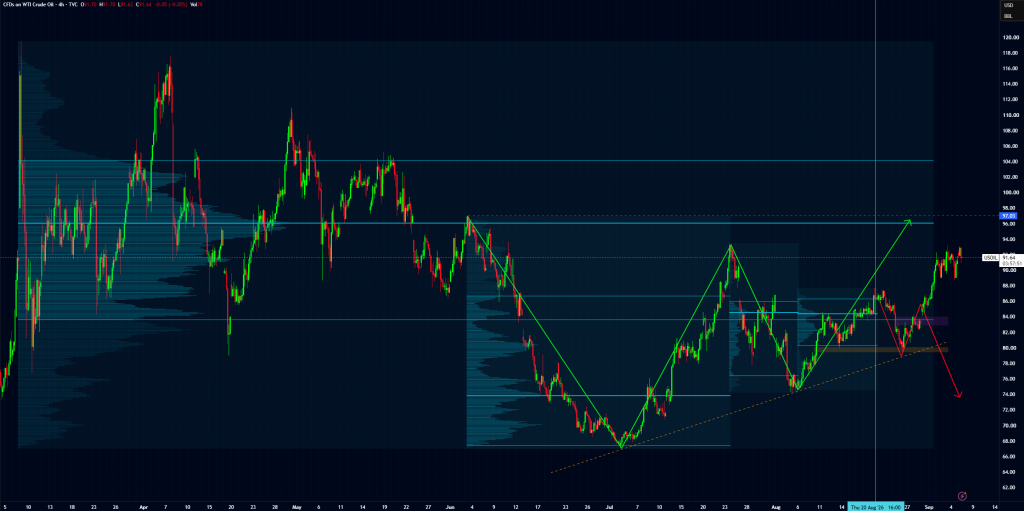
The $92–93 area has therefore become much more than a simple technical resistance zone. It is where the market is now deciding whether the buffers built over the past few months are still large enough to absorb the shock.
Introduction — The Question Has Changed
The central question over the past several weeks was never simply whether the situation in the Gulf was serious.
That was already clear.
The real issue was determining how much of that seriousness had already been priced in, and how much remained primarily narrative-driven.
Throughout July and August, WTI repeatedly reacted to reports of negotiations, temporary corridors, possible Iran-Oman arrangements, US statements and expectations that maritime traffic might normalize. At times, the market rapidly compressed its risk premium even while physical shipping data continued to show that the Strait was far from normal.
August 25 captured that phase particularly well. WTI closed at $82.36, while Brent settled at $88.58, during a session dominated by de-escalation expectations. Yet at the same time, reports indicated that the Iran-Oman framework for managing Hormuz had not yet been finalized, while Tehran’s conditions for a full reopening remained incompatible with the US position.
The following day, only five commodity vessels were reported to have crossed the Strait, against a much higher historical average and a ten-day moving average of roughly fifteen.
A crucial distinction had therefore emerged:
normalization of the narrative does not necessarily mean physical normalization.
That distinction has now become even more important.
Because this time, the next step has actually occurred.
From Headline Risk to Physical Risk
Until only a few days ago, the maritime conflict could still be interpreted through a relatively clear separation.
On one side stood direct military confrontation between Iran and the United States.
On the other stood Iranian attacks, threats or restrictions directed at commercial traffic moving through Hormuz.
Over the weekend, that distinction weakened significantly.
CENTCOM said it had struck three Iranian tankers, one of them in waters close to Kharg Island, Iran’s main oil export hub. The United States described the action as retaliation for an IRGC ballistic missile attack against two US Navy vessels. Iran later said it had hit three tankers allegedly travelling along unauthorized routes and another three vessels linked to the United States.
The economic significance goes well beyond the number of ships involved.
For the first time in this phase of the conflict, tankers are no longer simply collateral exposure to geopolitical risk. They are becoming instruments through which pressure is applied to the opposing side.
That is a substantial change.
A missile strike against a military asset can increase the oil market’s risk premium.
An attack against the system that physically transports oil can instead affect insurance premiums, vessel availability, shipowners’ willingness to enter the Gulf, delivery times, freight costs and ultimately the ability to move barrels from producer to customer.
This is the transition from:
risk of disruption
to
disruption being used as part of the conflict itself.
Maritime intelligence firm Marisks described the events as a major escalation in the maritime conflict.
The point is not that three tankers alone are enough to create a global supply shock. They are not.
The point is that a precedent has now been established.
And in physical markets, precedents can change behaviour before they materially change volumes.
Hormuz Is No Longer an On/Off Switch
The simplest way to think about the Strait of Hormuz has traditionally been binary:
open or closed.
The current situation shows why that model is no longer sufficient.
Iran has announced that it will publish a new restricted maritime zone in the Gulf, together with updated maps for an international shipping corridor through the Strait. Tehran has also linked its willingness to guarantee access through Hormuz to an end to US attacks and threats against Iran.
This fits into a broader process that had already been developing over previous weeks.
Iran had expanded its blacklist to include 56 vessels, ranging from crude tankers to LNG carriers, LPG carriers and product tankers, while also threatening consequences for ships involved in ship-to-ship operations with vessels deemed unauthorized.
The result is a system far more complex than a simple closure:
authorized corridors, blacklists, restricted zones, US controls, Iranian controls, selective transits, STS transfers, rerouting and shipowners independently deciding that the risk is no longer acceptable.
This is effectively a form of selective control over the choke point.
Economically, it can be nearly as important as a formal closure.
A vessel does not need to be physically prevented from crossing for the cost of transporting its cargo to rise.
The perceived probability of an incident simply needs to rise far enough.
The Physical Data Still Contradict Any Idea of Full Normalization
The ten-day average has now fallen to roughly 10 commodity vessels per day, the lowest level since May. Before the conflict, roughly one-fifth of global oil supply moved through Hormuz.
Estimates of the actual volume of crude and refined products still crossing the Strait can differ depending on methodology, especially because of disabled transponders, shadow-fleet activity and intermediate transfers.
But the robust conclusion remains unchanged:
flows are still well below the nearly 20 million barrels per day that moved through the area before the war.
This is important when assessing recurring claims that shipping activity is returning close to normal.
The market should not be interpreted through one single number.
The entire system matters:
number of transits + volumes + destinations + journey times + insurance costs + vessel availability + inventories + logistical workarounds.
On that broader basis, conditions remain clearly abnormal.
The Blockade of Iran Reveals Another Side of the Shock
A second dynamic deserves attention because it helps explain the strategic structure of the conflict.
The US blockade on Iranian oil exports has achieved results that years of financial sanctions had struggled to produce with the same effectiveness.
By early September, Iran had gone for roughly seven weeks without significant crude exports through Hormuz. Since mid-July, no new Iranian cargo had reportedly managed to reach China through the Strait according to major tanker-tracking firms.
Estimates for August placed Iranian loadings at around 220,000–255,000 barrels per day, compared with roughly 740,000 in July and around 2 million in March.
This makes the current struggle over maritime routes easier to understand.
For Tehran, controlling Hormuz is not simply a military issue.
It is one of the few instruments available to offset pressure on its own ability to export oil.
For Washington, by contrast, allowing uncontested Iranian control over regional shipping would reduce the effectiveness of the blockade.
There is no need to assume hidden coordination to identify the underlying power game: both sides have clear economic and strategic incentives to turn navigation itself into a negotiating lever.
That is precisely what makes rapid normalization so difficult.
OPEC+ Can Produce Barrels. It Cannot Necessarily Deliver Them
The September 6 OPEC+ decision adds another constructive element for oil prices.
The seven countries involved in the latest monthly decisions kept October production targets at the same levels planned for September. The previous decision had completed the gradual return of part of the earlier production cuts. For October, however, there will be no additional increase.
The next meeting is scheduled for October 4.
At first glance, this may appear to be merely a cautious policy choice.
Under current conditions, it matters more than that.
One of the oil market’s traditional safety valves works like this:
prices rise → producers with spare capacity increase output → the shock is partially absorbed.
But the war introduces a different constraint.
OPEC+ can change nominal quotas without guaranteeing that every barrel is actually produced, shipped and delivered to customers.
This is the difference between geological supply and deliverable supply.
If a producer has oil available but the tanker cannot pass through the relevant route, that capacity does not translate into effective market supply.
And an OPEC+ quota cannot solve a choke point.
So Why Is WTI Not Already at $110–120?
This is probably the most interesting question.
Tankers have been attacked.
Hormuz remains severely impaired.
Iranian exports have been heavily constrained.
OPEC+ is not adding incremental supply for October.
Diesel prices are at record levels.
Fuel oil markets are becoming increasingly tight.
Taken individually, these factors might suggest a much higher crude price.
Yet WTI continues to trade around the low $90s.
The explanation is not that the physical shock is irrelevant.
It is that part of the shock is being offset elsewhere in the system.
And this is where China becomes central.
China Has Become One of the Market’s Main Shock Absorbers
Chinese seaborne crude imports rose slightly from 6.93 million barrels per day in July to 7.14 million in August, but they remain almost 40% below the 11.41 million bpd average recorded during the three months before the conflict.
The comparison with the rest of Asia is even more revealing.
Asian seaborne crude imports fell by roughly 4.29 million barrels per day compared with pre-conflict levels.
China alone accounted for about 4.27 million bpd of that decline.
In purely arithmetic terms, almost the entire Asian adjustment has therefore come through the world’s largest crude importer.
One distinction is important.
A 40% fall in seaborne imports does not automatically mean a 40% decline in Chinese oil consumption.
Part of the adjustment can be absorbed through inventories, pipeline imports, greater use of Russian crude, lower refinery runs, reduced product exports and other forms of substitution.
But from the perspective of the global seaborne market, the immediate effect is still powerful:
China is demanding far fewer barrels from the maritime market precisely while the system is struggling to move enough oil.
That is a form of rationing.
Under normal circumstances, price itself would have to rise enough to destroy the required amount of demand.
In this case, part of that adjustment has already taken place.
That is one of the main reasons why a severely disrupted Hormuz can coexist with WTI still below $100.
But the Chinese Buffer May Not Be Permanent
The same China that is currently protecting the market from a more aggressive repricing could eventually become one of the channels through which renewed upside pressure returns.
Russian seaborne crude arrivals rose to 1.68 million barrels per day in August, from 1.40 million in July, on top of roughly one million barrels per day arriving by pipeline.
Even more important is what is happening downstream.
Chinese exports of light and middle distillates increased from a pre-conflict average of around 713,000 barrels per day to 774,000 in July and 963,000 in August.
That creates a potentially important feedback loop.
Very strong refining margins make higher refinery utilization more attractive.
Higher refinery runs require more crude.
More crude demand reduces China’s contribution to global demand destruction.
The buffer that has helped prevent a sharper oil rally could therefore gradually narrow.
This may be one of the less visible, but more important catalysts to monitor.
The Real Stress Is Showing Up in Refined Products
Crude is the most closely watched price.
It is not necessarily the one that best reflects the condition of the system.
US diesel has reached roughly $5.82 per gallon, while the diesel crack spread has climbed to around $108 per barrel at its intraday peak.
Those are extreme levels.
The crack spread is, in simplified terms, the economic value of converting crude into refined product.
When crude remains relatively contained while refined products surge, the market is signalling that the bottleneck is no longer only in the raw material.
It lies in the ability to process it and deliver the right product to the right place at the right time.
That is exactly what the current market is beginning to show.
From Diesel to Bunker Fuel: The Shock Is Moving Into Global Logistics
Fuel oil is now adding another layer of stress.
Energy Aspects expects a third-quarter fuel-oil deficit of roughly 218,000 barrels per day, compared with only 6,000 bpd during the same quarter a year earlier.
Inventories across major hubs such as Singapore, Amsterdam-Rotterdam-Antwerp and Fujairah are roughly 30% below normal seasonal levels.
Singapore very-low-sulphur fuel oil had risen by around 76% since the war began, compared with roughly 40% for Brent over the same period.
The transmission chain becomes increasingly clear:
crude → refineries → diesel and fuel oil → bunker fuel → shipping → cost of goods.
If bunker costs rise, vessel operating costs rise.
If shipping costs rise, the cost of moving goods rises.
If vessels are simultaneously forced to take longer routes to avoid high-risk areas, the system also consumes more fuel to move the same amount of cargo.
The energy shock therefore begins to propagate beyond the oil market itself.
Is Crude Underpricing the Shock, or Are Products Leading It?
This is one of the key observations.
There are at least two possible interpretations.
The first is that diesel and fuel oil are experiencing a largely refinery-specific crisis, amplified by attacks on Russian and Middle Eastern processing infrastructure.
The second interpretation matters more for WTI:
refined products may be showing earlier than crude just how fragile the energy supply chain has become.
Under this second reading, WTI is not necessarily “wrong.”
It may simply be the last part of the system required to adjust, because lower Chinese imports and other workarounds are still temporarily easing pressure on crude itself.
That divergence deserves close attention.
The Energy Shock Is Also Building Its Own Brake
Oil contains a self-correcting mechanism.
The higher energy prices rise, the more inflation increases.
The more inflation rises, the longer central banks are forced to maintain restrictive policy.
The tighter financial conditions become, the greater the risk of slower economic activity.
And the slower the economy becomes, the weaker future oil demand becomes.
Diesel is particularly important because it feeds directly into transport, agriculture and industrial costs.
This creates an endogenous bearish force.
The war does not necessarily need to end for an oil rally to lose momentum.
The economic damage caused by high energy prices can eventually do that on its own.
That is why structurally bullish does not mean prices must rise in a straight line.
Goldman and the Real Meaning of $120 Oil
Goldman Sachs now sees the possibility of oil reaching roughly $120 per barrel if attacks against Middle Eastern shipping intensify further.
At the same time, it sees prices falling back toward roughly $80 if regional exports normalize.
Those figures should not be treated as precise targets.
They are more useful as a representation of market convexity.
This is not a linear system in which every tanker attack adds two dollars to WTI.
The market can remain relatively stable while participants continue to adapt.
Then a threshold can be reached where marginal adaptation is no longer sufficient.
At that point, prices must move much more aggressively to force rationing.
The distance between $80 and $120 is a good illustration of that asymmetry.
$92–93 Is No Longer Just Resistance
WTI recorded:
$92.29 on September 2,
$93.14 on September 3,
$92.17 on September 4,
before returning to the same region on September 7.
The $92–93 range has therefore taken on a different function.
Previously, it could largely be interpreted as a technical resistance area coinciding with an already elevated geopolitical risk premium.
Now the market is testing it after:
direct tanker attacks, Hormuz traffic falling to its lowest level since May, new Iranian restrictions and unchanged OPEC+ output policy.
The physical deterioration that had previously been identified as the likely catalyst required to break the area has now materialized.
And yet the market is still hesitating.
That hesitation is information.
The Critical Observation
If $92–93 is rejected once again even after the weekend’s escalation, the message would not necessarily be:
“geopolitics no longer matters.”
It would be something more interesting:
“the system’s capacity to adapt is still worth more than the marginal deterioration in physical supply.”
In that case, corrections toward:
$90 → $89 → $87
would become increasingly plausible without necessarily invalidating the broader structural bullish thesis.
A pullback could simply represent a temporary compression in the risk premium against a physical market that remains fundamentally impaired.
But Above $93, the Interpretation Changes
An intraday breakout would not be enough.
A wick to $93.10 or $93.30 in a thin market would not materially alter the structure.
A more meaningful confirmation would look something like:
break above $93 → pullback → hold above the former resistance → fresh highs.
That kind of price action would suggest that the market no longer considers the adjustment achieved through China, logistical workarounds and demand destruction sufficient.
At that point, $96–97 would become the natural next area.
And above $97, the geometry changes again.
The psychological distance from $100 becomes minimal, and further acceleration would no longer represent only a tail-risk event. It would increasingly look like the beginning of genuine price discovery.
Market Map
The current structure can be organized around four broad forces.
Structural Bullish Forces
Hormuz traffic remains dramatically below normal; tankers have become directly involved in the military confrontation; Iranian exports are heavily constrained; OPEC+ is not adding further supply in October; and diesel, fuel oil and refined-product inventories continue to show significant stress.
Bearish Shock Absorbers
China has sharply reduced seaborne purchases; alternative routes, STS transfers and Russian crude continue to provide partial substitutes; Iraq and other producers are attempting to raise exports; and elevated energy prices are creating marginal demand destruction.
Transition Variables
Chinese refinery activity, refined-product exports, actual Hormuz transit volumes and logistical costs will determine how long the current shock absorbers can continue to function.
Macro Restraining Forces
Energy inflation, elevated interest rates and slower growth represent the main mechanism through which a further oil rally could eventually begin to destroy its own demand.
Dominant Hypothesis
The previous framework:
structurally bullish / tactically neutral-bullish
now shifts to:
STRUCTURALLY BULLISH + TACTICALLY BULLISH, BUT BREAKOUT STILL UNCONFIRMED
The reason is concrete.
The physical catalyst identified in previous analysis has now materialized.
The market is no longer discussing only the possibility that commercial oil shipping might become directly involved in the conflict.
It already has.
At the same time, OPEC+ has not provided an incremental supply response for October, while refined products continue to show significantly greater stress than crude itself.
The main obstacle to an immediate continuation of the rally therefore remains the buffer created through lower imports, logistical adaptation and demand destruction.
That is why $92–93 now matters much more than it did during previous tests.
The same price level is now being tested against a different fundamental backdrop.
Catalysts to Monitor
Hormuz: not only the daily vessel count, but the direction of the ten-day average. A sustained recovery would weaken the bullish thesis; fresh lows would strengthen it.
Iranian restricted zone: the definitive maps, geographic scope and actual enforcement mechanisms will matter more than the announcement itself.
Further tanker attacks: repetition would be far more important than the first incident because it would turn a precedent into a pattern.
Kharg Island: material damage to Iran’s main export hub would carry a different significance from isolated attacks on individual vessels.
China: a simultaneous increase in crude imports and refined-product exports would reduce one of the market’s most important shock absorbers.
Diesel crack: sustained extreme spreads would continue to signal physical stress downstream.
Fuel oil and bunker markets: further increases could transfer the energy shock directly into global shipping costs.
OPEC+: the next meeting on October 4 would become especially important if WTI were to establish itself above $100.
US-Iran-Oman diplomacy: another announcement would not be sufficient. The relevant signal would be a measurable improvement in physical flows through the Strait.
Scenarios and Decision Compass
Scenario 1 — The Shock Is Absorbed
WTI fails to establish acceptance above $92–93.
Transit volumes gradually improve, tanker attacks remain isolated incidents, the new restricted zone does not cause a further collapse in traffic and China continues to keep seaborne imports low.
In this case, the market would demonstrate that its adaptation mechanisms remain effective.
The next area to monitor would become:
$90 → $89 → $87.
The structural thesis would remain constructive, but the tactical premium would be reduced.
Interpretation: structurally bullish, tactically neutral/bearish.
Scenario 2 — Controlled Breakout
WTI moves above $93, absorbs the pullback and begins building price above the former resistance.
Hormuz remains severely constrained, OPEC+ adds no meaningful barrels, China gradually starts increasing purchases again and refined products remain under pressure.
Natural next target zone:
$96–97.
The significance would be that the market had started assigning greater value to physical deterioration than to its remaining adaptation capacity.
Interpretation: structurally bullish and tactically bullish.
Scenario 3 — Second Phase of the Physical Shock
Repeated tanker attacks, a further decline in transit volumes, material disruption around Kharg or other infrastructure, rapidly rising shipping and insurance costs and a simultaneous recovery in Chinese crude demand.
Above $97, the market would increasingly enter a different regime.
$97 → $100 would start to look more like price discovery than a simple technical extension.
Above $100, the $110–120 area should be treated as a stress scenario, not as an automatic target.
Interpretation: physical shock entering a propagation phase.
Scenario 4 — Genuine Normalization
A verifiable agreement on the Strait, a sustained increase in transit volumes, an end to attacks on commercial shipping, a recovery in regional exports and gradual normalization in refined-product markets.
Under this scenario, the risk premium could compress very quickly.
The $80 area highlighted in Goldman’s normalization scenario would become plausible again.
Interpretation: regime change.
Decision Compass
| Driver | Prevailing Impact |
|---|---|
| US attacks on Iranian tankers | Strongly bullish |
| Iranian attacks on commercial shipping | Strongly bullish |
| Hormuz at ~10 commodity vessels/day | Strongly bullish |
| New Iranian restricted zone | Bullish / magnitude uncertain |
| OPEC+ unchanged for October | Bullish |
| Iranian exports heavily constrained | Bullish |
| Diesel crack near record highs | Strongly bullish |
| Fuel-oil deficit | Bullish |
| Recovery in Chinese refined-product exports | Potentially bullish for crude |
| Chinese seaborne crude imports down ~40% | Strongly restraining |
| STS transfers and logistical workarounds | Restraining |
| Demand destruction | Bearish |
| Inflation → rates → weaker growth | Bearish over the medium term |
Conclusion — The Market Must Now Reveal the Size of Its Buffer
The weekend did not simply add another set of headlines to an already complicated conflict.
It changed the quality of the risk.
For weeks, the main question was whether statements, negotiations and threats surrounding Hormuz would eventually produce physical consequences serious enough to justify a new price regime.
Part of that answer has now arrived.
Tankers have been directly involved.
Traffic remains deeply depressed.
Iran is preparing further restrictions.
OPEC+ is not adding incremental barrels for October.
Refined products are showing scarcity conditions far more extreme than crude alone would suggest.
Yet crude itself continues to struggle below a relatively precise threshold.
That is what makes the current market particularly informative.
The market is no longer deciding whether the risk is real.
It is deciding how much capacity the system still has to absorb it.
So far, the answer has come mainly through China, marginal demand destruction and the ability of market participants to redesign trade routes.
But a shock absorber does not eliminate a shock.
It spreads it through time.
And the longer Hormuz remains impaired, the more pressure migrates from crude to refined products, from refined products to shipping, from shipping to corporate costs, and eventually from corporate costs to inflation and economic growth.
That is why $92–93 now carries much more meaning than an ordinary technical resistance zone.
If the market rejects it again, it will demonstrate that adaptation remains powerful enough to absorb even a physical escalation.
If the market breaks above it and then successfully defends the area, the message will be the opposite:
the buffer is beginning to fail.
At that point, $93 → $97 → $100 would no longer be just a sequence of price levels.
It would describe the transition from a market that is still absorbing the shock to one that is finally being forced to price it.
Useful Frameworks for Reading the Market
Some of the dynamics that have emerged during this phase of the oil market are useful well beyond the current episode. They offer a broader framework for interpreting future shocks.
Headline escalation vs physical escalation
Not every escalation carries the same economic significance. A statement, threat or failed negotiation primarily affects expectations. An attack on tankers, infrastructure, ports or trade routes can instead affect the system’s physical ability to produce, transport or deliver energy. The first tends to alter the risk premium; the second can evolve into genuine damage pricing.
Risk premium vs damage pricing
The risk premium reflects the price assigned to the possibility that something may happen. Damage pricing begins when the disruption becomes visible in flows, inventories, logistical costs or production capacity. The distinction matters: markets can quickly remove a fear premium when a threat fades, but they cannot as easily replace barrels that are actually missing.
Nominal supply vs deliverable supply
What matters is not only how much oil can theoretically be produced, but how much can actually reach the customer. OPEC+ can raise a production quota, but a quota cannot solve an impaired Strait, a shortage of available tankers or a surge in insurance costs. The economically relevant supply is therefore deliverable supply.
A choke point is a system, not a switch
Hormuz shows that a Strait does not need to be fully closed to become economically dysfunctional. Selective restrictions, blacklists, authorized routes, threats to vessels, higher insurance premiums and logistical workarounds can reduce effective capacity while the passage remains formally open.
Shock absorber
A market can suffer a major shock without immediately transferring the full impact into price. China, inventories, source substitution, lower imports, STS transfers and marginal demand destruction can all act as shock absorbers. They do not eliminate the imbalance: they spread its effects over time.
The buffer has a size
When a market receives increasingly bullish news but the price stops advancing, this does not necessarily mean fundamentals no longer matter. It may mean that an existing buffer is still large enough to absorb them. A technical level can therefore become an indirect way of measuring the size of that buffer.
Acceptance matters more than the breakout
An intraday break can be noise. The more meaningful information comes when the market clears a level, pulls back, holds it and then resumes higher. At that point, the market is not simply producing a wick: it is showing acceptance of a new price regime.
A price level as a referendum on fundamentals
The $92–93 area should no longer be seen only as technical resistance. After the physical escalation, it becomes a question posed to the market: are these new fundamentals actually worth a higher price? The stronger the catalyst, the more informative a rejection of that level becomes.
Structural bias vs tactical bias
A medium-term thesis can remain bullish while the tactical setup turns bearish. There is no contradiction. Structurally bullish describes the broader fundamental regime; tactically bearish may simply describe a temporary compression in the risk premium or an overextended price move.
Second-order effects
The most important shock is not always the one immediately visible in crude. Higher oil prices can tighten refining margins, send diesel and bunker fuel sharply higher, raise shipping costs, feed inflation and eventually weaken economic activity. Sometimes the most useful signal appears one or two steps further down the chain.
Products leading crude
Diesel, crack spreads and fuel oil can reveal problems before crude fully reflects them. When refined products show much greater stress than the underlying feedstock, the bottleneck may have shifted from crude availability to the ability to process and distribute it.
Demand destruction as a natural stabilizer
Oil carries its own internal brake. Higher prices destroy demand, increase inflation, tighten financial conditions and weaken growth. A strongly bullish scenario can therefore gradually create the conditions that ultimately limit its own extension.
Convexity
In markets exposed to logistical shocks, the relationship between deterioration and price is not linear. The system may absorb multiple disruptions with relatively modest price moves; once a threshold is crossed, however, small additional shocks can produce much larger moves. This is why $80 and $120 scenarios can coexist within the same risk distribution.
Tail risk does not mean target
A possible move in WTI toward $110–120 should not be interpreted as the central forecast. It is a way of measuring what could happen if several compensating mechanisms were to fail at the same time.
Price discovery
Above certain thresholds, the market may lose recent reference points strong enough to anchor price. At that stage, it is no longer simply breaking resistance: it is searching for a new equilibrium between supply and demand. That is when true price discovery begins.
Monitor the pace, not only the level
Ten vessels per day is a data point. The direction of the ten-day average is even more informative. The same applies to Chinese imports, crack spreads, inventories and freight rates: the rate of deterioration often matters before the absolute level does.
Separate event, effect and interpretation
A basic discipline in geopolitical analysis is to distinguish between three layers: what happened, what it materially changed, and what the market may infer from it. This prevents a plausible narrative from being treated as a fact.
Follow incentives rather than assigning intentions
There is no need to assume hidden coordination in order to analyze a power struggle. It is often enough to ask: who benefits from this outcome? What constraints does each actor face? What leverage do they possess? Which costs are they trying to shift onto the other side? Incentives are far more observable than intentions.
The shock does not disappear; it moves
When crude temporarily stops rising, the tension may shift into diesel, bunker fuel, insurance, freight rates, inflation or industrial margins. In a complex system, stability in one price does not necessarily mean stability in the wider energy chain.
Sources
- Reuters — September 7, 2026
Oil extends gains after US and Iran exchange attacks on ships. - Reuters — September 7, 2026
Iran says to announce new restricted zone in the Gulf in coming days. - Reuters — September 7, 2026
China’s crude oil imports stayed weak in August. Can this continue? - Reuters — September 7, 2026
Ship fuel shortage looms as refiners strained by war favour other products. - Reuters — September 7, 2026
Goldman sees $120/bbl oil risk if attacks on Middle East vessels intensify. - Reuters — September 6, 2026
OPEC+ keeps oil output policy unchanged for October. - Reuters — September 5, 2026
US, Iranian forces fire at vessels in waters near Iran. - Reuters — September 4, 2026
Oil set for steepest weekly gain since mid-July over intensifying US-Iran tensions. - Reuters — September 3, 2026
US diesel prices hit record high as conflicts intensify supply crunch. - Reuters — September 2, 2026
Iran blacklists more ships trying to sail through Hormuz. - Reuters — September 1, 2026
Blockade succeeds where sanctions failed as Iran oil exports stall. - Reuters — August 26, 2026
Gulf ship traffic via Strait of Hormuz hovers below 10-day average. - Reuters — August 25, 2026
Iran, Oman discuss temporary Hormuz corridor as impasse with US drags on. - OPEC — September 6, 2026
Official statement on October 2026 production levels. - OPEC — August 2, 2026
Official statement on the September 2026 production adjustment. - Investing.com
WTI crude oil historical price data used for the September 2–4 price references.